September 29, 2026
Paycheck Budget Planner: Weekly & Biweekly Bill Plan
Build a paycheck budget planner that assigns every bill to the check that covers it, plus a worked biweekly example and a fill-in table.
Read article


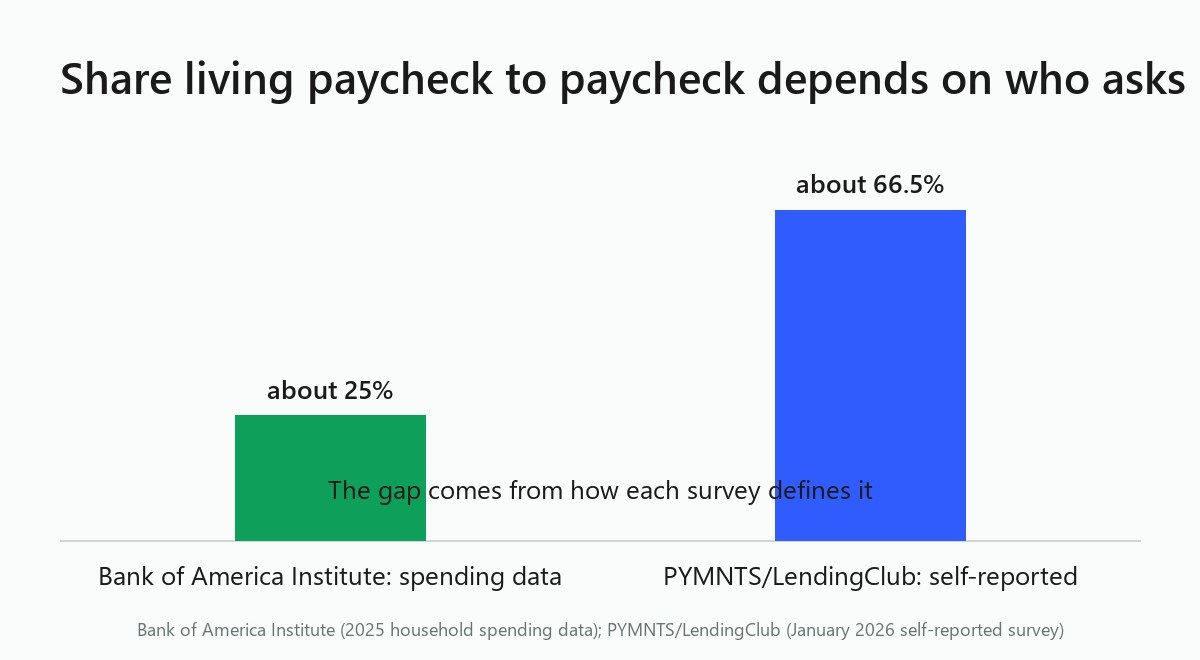
Ask how many Americans live paycheck to paycheck and you'll get a different answer depending on who you ask: roughly a quarter of households by one measure, about two-thirds by another. Neither number is wrong. They're just answering different questions, and headlines quote whichever one is most dramatic that week, with no explanation of why they disagree.
If you've seen your own number somewhere and felt like you were failing a test everyone else was passing, take a breath. The test itself keeps changing depending on who wrote it. You didn't miss a memo. Nobody agreed on the memo in the first place.
The answer comes down to which survey you're reading and what that survey counts as "paycheck to paycheck" in the first place. One tracks how much of your income goes to necessities, one asks people how they feel about their own bill-paying, and one asks whether you spent less than you earned last month, a related question but not quite the same one. Three different survey teams, three different starting questions, three different numbers that all get reported under the same headline phrase.
Each approach is measuring something different and calling it by the same name, so no single one of them is more correct than the others. Here's what each one actually measures, and what to do if your income band shows up in any of them.
Bank of America Institute found that nearly 25% of all U.S. households lived paycheck to paycheck in 2025, up 0.3 percentage points from the year before. Among lower-income households, that figure was 29%, climbing from 27.1% in 2023. For middle- and higher-income households, the Institute reported "little to no increase" compared to prior years, without publishing an exact percentage for those tiers.
What makes this number distinct is where it comes from. BofA isn't asking people how they feel about money. It's pulling from its own deposit and card transaction data and defining paycheck to paycheck as spending more than 95% of income on necessities: housing, groceries, gas, utilities, internet, public transit, and childcare. There's no survey question in that process at all, just what the transactions themselves show.
That's a hard spending-share threshold, not a mood, and it's part of why this number runs lower than the others. A household can feel stretched thin without technically crossing a 95% necessities line, which is exactly the gap the next section digs into.
PYMNTS Intelligence, working with LendingClub, put the number much higher in its January 2026 survey wave: about two-thirds of U.S. consumers said they live paycheck to paycheck. That figure breaks into two groups: 23.8% who said they struggle to pay their bills, and 42.7% who said they live paycheck to paycheck but pay their bills without difficulty. Add those together and you get roughly 66.5%, which the report rounds to "two-thirds."
The income breakdown here stands out. Consumers earning $100,000 to $150,000 a year still reported living paycheck to paycheck at just over six in ten, north of 60%. Among consumers earning more than $150,000, that figure was 46.0%, which the report frames as often reflecting lifestyle choices rather than financial necessity.
This is a self-report survey. It asks consumers to describe how they pay their bills and whether they run short before the next paycheck lands, which captures something spending-share data can't: how tight things feel, even when the math on paper looks fine. That's a real, useful signal. It's just a different signal than BofA's.
The Federal Reserve's Survey of Household Economics and Decisionmaking (SHED) does not report a "percent living paycheck to paycheck" figure at all. It asks different, related questions.
In the 2024 survey wave, fielded October 18 to 31, 2024 and published May 28, 2025, 73% of adults reported doing okay financially or living comfortably. That's down from a high of 78% in 2021 but essentially flat with the 72% to 73% range seen from 2022 through 2024.
Separately, 51% of adults said they spent less than their income in the month before the survey, up from 48% in 2023. Flip that around and it means roughly half of adults spent all or more than they earned that month.
It's easy to read that 51% as a fourth paycheck-to-paycheck number. It isn't one. It's a financial-cushion measure, useful and real, but it answers "did you spend less than you earned," not "do you live paycheck to paycheck," which keeps it from standing in for either of the other two.
Econofact, a fact-check outlet affiliated with Tufts University, addressed this exact question directly: "the lack of consensus may be explained by the ambiguity of the term 'paycheck to paycheck.'"
Their example is a clean one. In a past Bank of America survey wave, roughly half of respondents self-identified as living paycheck to paycheck when asked directly, even though only about a quarter of households actually met BofA's own 95%-of-income spending threshold. Same bank, two very different answers depending on whether you ask people how they feel or check what their transactions show.
So what does living paycheck to paycheck mean in practice? It depends entirely on who's asking and how.
A spending-share model asks an objective question about where your money physically goes. A self-report survey asks a subjective one about how secure you feel. A financial-cushion measure like SHED asks whether last month's numbers came out ahead or behind. Three different questions, three legitimate but non-interchangeable answers.
BofA tells you whether necessities are eating your income. PYMNTS tells you how tight things feel day to day. SHED tells you whether last month came out ahead or behind. Knowing which question a number is answering matters more than knowing the number itself.
It's also worth knowing who's behind each figure. SHED comes from the Federal Reserve Board, a government agency with no product to sell you, which gives it a particular kind of credibility. BofA Institute's data comes from a bank's own transaction records, disclosed with its methodology attached. PYMNTS and LendingClub run a commercial consumer survey, published and dated the same way the others are.
All three are legitimate, primary sources, and none of them is neutral in the sense of having no institutional perspective at all. That's fine. It just means knowing whose lens you're looking through before you decide how much weight to give any single headline.
Here's where this stops being trivia and starts being useful. Each income band shows up differently across these surveys, and each one points toward a different first move you can actually make. The point isn't to find your exact percentage and stop there. It's to find the first move that matches your actual situation.
Bank of America Institute's lower-income households sat at 29% living paycheck to paycheck by its spending-share measure, up from 27.1% in 2023. Because that metric is specifically about the share of income going to necessities, the highest-leverage move isn't cutting coffee runs or streaming subscriptions. It's shrinking one recurring necessity bill: a utility plan, a transit pass, an insurance premium, a phone plan.
Necessities are what's driving the number for this group, so a necessity is where a dent actually shows up. Pick one bill this week, call the provider or shop a competitor, and see what moves. Even a modest reduction on one recurring line item moves the needle on a metric built entirely around recurring costs, in a way that skipping a few takeout orders never will. If you want a fuller framework for building breathing room month to month, our guide on simple budgeting tips walks through it step by step.
PYMNTS found that just over six in ten consumers earning $100,000 to $150,000 still describe themselves as living paycheck to paycheck. If that's you, the first move is an honest income-versus-obligations check. Pull up your fixed costs (housing, the car payment, subscriptions, insurance) next to what they were before your last few raises.
Fixed costs can climb in step with raises, quietly erasing the cushion a bigger paycheck should have bought. You won't fix that by trimming discretionary spending alone. A latte budget cut doesn't move a number that's really being driven by a car payment or a housing upgrade. You fix it by finding which fixed cost grew the most and deciding, deliberately, whether it still earns its place in your budget.
Among consumers earning more than $150,000, PYMNTS found 46.0% still living paycheck to paycheck, a figure the report frames as often reflecting lifestyle choices rather than necessity. If that describes your situation, there's no shame in it. When it's a choice, it's one you get to make.
The first move here is simply separating "choice" spending from "shock" protection. Keep the lifestyle spending if it's genuinely what you want, but build a real emergency reserve alongside it, not instead of it, so a job loss or a medical bill doesn't turn a choice into a crisis. A high income with no cushion underneath it is still fragile, just fragile at a higher altitude. Our guide to building an emergency fund on a low income covers the same mechanics even if your income isn't low; the math of setting money aside first works at any income level.
And if your income doesn't land in a clean band because it changes month to month, whether you're on tips, gig work, or hourly shifts, the paycheck-to-paycheck question hits differently for you too. One good month can look nothing like the next. Our piece on managing irregular income is built for exactly that situation.
If you read three headlines this year with three different percentages, you weren't imagining things and you weren't misreading anything. Not one of those numbers is a verdict on you personally.
None of them means you're worse off than everyone else, either, because "everyone else" isn't one group being measured one way. Someone can technically pass BofA's spending-share test and still feel like they're drowning by PYMNTS' self-report standard. Both feelings are real, and both are worth taking seriously instead of arguing yourself out of one because a different survey said something rosier. Your bank balance and your stress level are both telling you something true, even when they point in different directions.
What actually matters is your own number, measured on the terms that make sense for your situation, and what you do with it this week. If you're ready to build an actual plan instead of just understanding where you fall, our full guide on how to stop living paycheck to paycheck lays out the step-by-step approach. This article was about understanding the math behind the headlines. That one is about changing yours.
It depends on the survey. Bank of America Institute found nearly 25% of U.S. households met its spending-based definition in 2025, while PYMNTS Intelligence and LendingClub found roughly two-thirds of consumers describe themselves as living paycheck to paycheck in a January 2026 self-report survey. Both are accurate for what they measure; neither cancels out the other.
Bank of America Institute found 29% of lower-income households met its spending-share threshold in 2025. PYMNTS found just over six in ten consumers earning $100,000 to $150,000, and 46.0% of consumers earning more than $150,000, still describe themselves as living paycheck to paycheck in its self-report survey. These come from different surveys with different definitions, so they aren't directly comparable.
It depends on who's measuring. Bank of America Institute defines it as spending more than 95% of income on necessities, a spending-based threshold. PYMNTS and LendingClub instead ask consumers to self-report how they pay bills. Neither definition is universal, which is why the reported percentages vary so widely.
No. That figure, from the Fed's SHED survey, measures the share of adults who said they spent less than their income last month, meaning roughly half spent all or more than they earned. It's a related financial-cushion measure, not a direct paycheck-to-paycheck percentage, and the SHED report itself doesn't use that phrase.
Because "paycheck to paycheck" isn't a standardized term with one accepted definition. Some surveys measure actual spending as a share of income; others ask people to self-report how secure their finances feel. Econofact, a Tufts-affiliated fact-check outlet, has directly documented this gap. Checking a headline's definition before comparing it to another is the fastest way to stop the numbers from feeling contradictory.

Build a paycheck budget planner that assigns every bill to the check that covers it, plus a worked biweekly example and a fill-in table.
Read article
We read through Reddit's cash advance app threads to sort real complaints from real advice, app by app.
Read article
Bill due this week? Compare the fastest emergency cash advance apps, real instant-transfer fees, and cheaper options to try first.
Read articleSee how the top earned wage access apps stack up on fees, limits, and speed. View the full ranking